
Crowdsourced data is helping society to forecast dangerous air quality. How can we. use these information models for other areas of business?
Major wildfires spanning several western states have so far burned approximately 4.6 million acres. That adds up to an area roughly the same size as Connecticut and Rhode Island combined. As of September 17, 2020, in California alone there have been numerous fatalities and over 6,000 structures destroyed or damaged. The smoke is impacting many areas even those not close to the fires the Midwest, the East Coast, and Canada. With the effects of the fires spread across whole regions, how can we obtain useful information? The answer is with crowdsourced data.
We Are Increasingly Relying on Air-Quality Data
With fires shrouding large areas in thick smoke and ash for days on end, worried residents are increasingly turning to data provided by sensors and apps to inform them of how bad the air is outside their homes and where they might go to escape. In recent years, in response to an obvious market need, several low-cost air quality sensors have become available. These monitors allow consumers to check the air pollutant levels in their own neighborhoods.
Scientists at Lawrence Berkeley National Laboratory have been assessing the reliability of low-cost monitors. Their tests of four different models (all costing under $300) show that these sensors provide reliable, actionable air quality data during actual wildfire events. The sensors tested were from: PurpleAir, IQAir, Air Quality Egg, and eLichens.
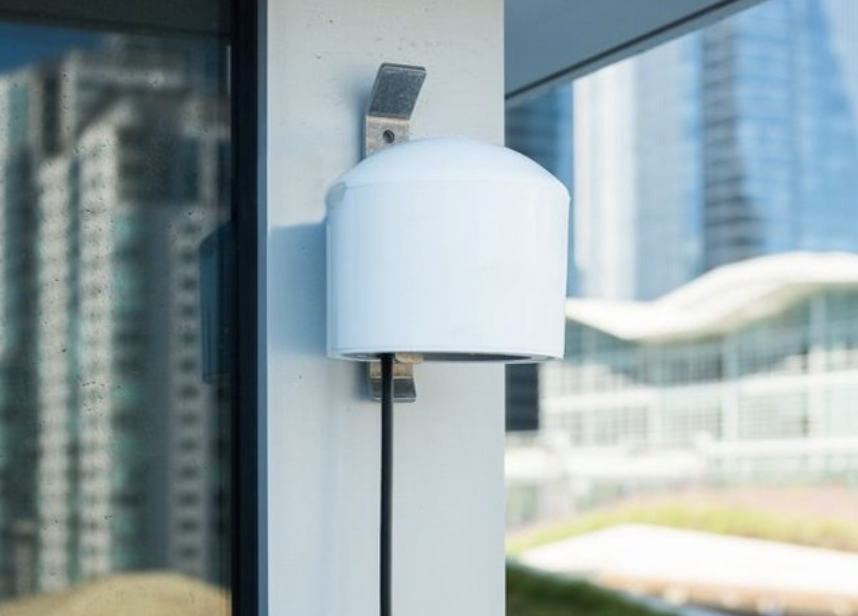
Data from PurpleAir
The company reports that its sensors are experiencing record sales and expects to double its twelve full-time employees (talk about lean!) during the current fire season to keep up with demand. Residents can also download PurpleAir s air quality crowdsourced map, which is free of charge. The map helps users understand the amount of smoke, where it is, how far and fast it is traveling, and where they might go to find cleaner air.
On September 9, 2020, as the skies over above San Francisco and Oakland turned a Blade Runner style disturbingly unnatural dark orange, approximately 600,000 people viewed PurpleAir’ s map in just one day. Most of these visitors were Californians, but users in Washington and Oregon were also accessing the site on the 9th and 10th, as Oregon was preparing to evacuate about 500,000 residents from the state’s most fire-prone areas.
How Does PurpleAir Obtain Its Data?
PurpleAir creates its map from crowdsourced data that streams in from its sensors. About 9,000 sensors are currently installed worldwide, up from approximately 6,000 from the same time last year. The map shows how bad the outside air is by employing a simple color-coded key:
Note: So far, during the worst days of the current fire season, the map showed most of the West Coast covered in purple/maroon dots. This signifies that emergency health conditions will likely occur for smoke exposure of more than 24 hours.
How PurpleAir’s Data Differs from Official Government Data
Interestingly, air quality measurements on the PurpleAir map are often higher than those on the AirNow site, which is under the auspices of federal agencies. This is because a PurpleAir sensor uses laser-based sensors. When particles end up in that beam of light, the sensor counts and assesses the reflections. Generally, the more reflections and the brighter they are, the more particles are present. However, the density that the sensor records can be slightly off depending on what is being measured. For instance, wood smoke particles typically have a density of 1.5 grams per cubic centimeter, whereas gravel dust particles are generally about 2.8 grams per cubic centimeter. However, Purple Air has many more sensors collecting information in urban areas than AirNow.
Cooperation Between the Government and PurpleAir
Recently, the U.S. Forest Service and the EPA launched a pilot plan to produce what might be called the perfect combination of crowdsourced air quality maps. The project combines readings taken from government monitoring devices with those from PurpleAir’s sensors in one single Fire and Smoke Map. The circles on the map show official government monitors, the triangles represent temporary federal monitors, and the squares indicate readings from PurpleAir.
The thinking is that using crowdsourced data from low-cost sensor networks such as PurpleAir’ s may prove to be the best way for the government to provide citizens with more accurate air quality data during wildfires. The official government air quality monitors are expensive because they have to monitor the effects of regulation over time, and the data has to hold up in court.
To manage air quality sensing on a large scale needs the community’s involvement in hosting and running sensors. This will involve placing sensors in poorer neighborhoods. For example, in Los Angeles, the Coalition for Clean Air, a nonprofit organization, is providing PurpleAir monitors to community members.
Other Air Quality Companies
Apart from PurpleAir, several other air quality companies are working to provide precise measurements of particulates in the air.
- IQAir This Swiss company has been operating a crowdsourced air quality monitoring network around the world for several years since its AirVisual Pro sensor was launched through a successful crowdfunding campaign. It has over 80,000 sensors, with a majority situated in the US. It attracted more than 1 million new visitors to its air quality maps between August 17 and September 10, 2020, as fires began to burn a record amount of acreage in California. Over that same time period, new visitors to IQAir’ s maps in Oregon increased by over 18,000% and in Washington by more than 8,000%.
- Air Quality Egg – The crowd-sourced Egg is a WiFi-enabled device that employs sensors to record changes in the levels of specified air contaminants. The monitor keeps track of any changes and automatically uploads the data to the cloud. Readings from the Egg can be shared and compared on a web-based crowdsourced dashboard. The Egg is also being used as a teaching device in schools.
- eLichens – This company’s eLos outdoor device is solar-powered and provides individual citizens, communities, and organizations with real-time data about the outside air quality. Users can integrate their station’s air quality information with public data to create eLichen’s integrated map.
Future Data Models: Crowd Data Integrated with Owned Data
The bigger trend with respect to measuring air quality is that sensors are everywhere, and new insights can be drawn from crowdsourcing. The aggregate collective data helps citizens, businesses, and governments make informed decisions with respect to air quality. Imagine a world where healthcare companies are aggregating crowd health data from wearables. Or retailers are gathering information from satellite data of how people are walking or driving. Businesses, government and people need real-time data in scale, and the best way to get this information may be from crowd-sourced sensors.
