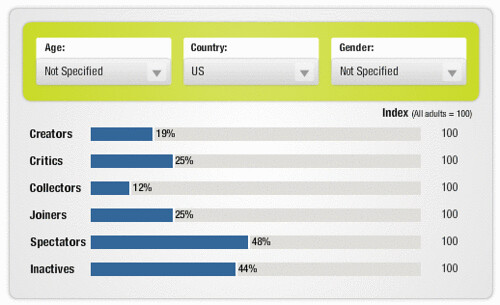
(Rather than theorize on the Community Pyramid, you can create your own ladder for free on the Technographics Profile Tool)
Respected Don Dodge has an interesting post where he segments communities by a taxonomy of: 1 creators, 10 synthesizers, and 100 consumers.
It’s a good rule of thumb, but it isn’t applicable to all communities. The good news is, there’s no need to theorize over the pyramid shape, as we’ve provided a ladder than you can access now –for free.
For Creators, I’m pretty sure we use the same nomenclature to describe a creator. You can learn from the links below how we define that individual. Don uses the term synthesizers, but doesn’t define it, I’d guess it’s a hybrid of what we define in detail as collectors and critics, but I’d need to know more to find out.
A consumer is likely what we call a Spectator, someone who consumes social content, within a community this of course would equal 100% as he denotes. Lastly, our data isn’t restrictive to one tool only (social networks) but looking at the macro picture of how people behave.
I love working at a Research company, there’s plenty of access to data, fortunately, we’ve made a portion of it available at no cost to you see the Techongraphics Profile Tool to learn more and actually see the REAL percentage numbers of a creator by age, regions, and gender.
You’ll then be able to see how many creators are available by each of those demographics, and how many are critics, collectors, and joiners. The total percent adds up to more than 100% in some cases, as you can be in more than one rung (except for inactive, of course)
How to access Forrester Technographic Data:
First, understand that Social Technographics classifies people according to how they use social technologies, read these 8 slides.
Next, go to the profile tool, and experiment with many of the drop downs and toggles.
Then, you can determine which social media tools to use, based upon understand those you are trying to reach. It’s always dangerous to build your house starting with a hammer (tools), first, figure out who you’re building it for, then build a plan.
Data comes from the following surveys:
US: Forrester’s North American Social Technographics Online Survey, Q2 2007, 10,010 respondents. Europe: Forrester’s European Technographics Benchmark Survey, Q2 2007, 24,808 respondents. Asia Pacific: Forrester’s Asia Pacific Technographics Survey, Q1 2007, 6,530 respondents.
Comments are closed.