Click on the above image, or you can advance to the Spreadsheet of the Collaborative Economy Funding, to see a multi-tab analysis of funding, which I update on a regular basis. Caveat: This sheet is incomplete: People continually submit new data to me, and early stage funding is often not reported in public.
The Collaborative Economy continues to be a darling of tech investors. In a few short years, these companies have received incredible amounts of funding, totaling nearly $7 billion across 169 startups, with no signs of it slowing. Startups continue to seek investors to raise more funds, and investors are pressured by their own partners to get into the sharing and collaboration space. Here’s a few previews of what you’ll find in the sheet:
- This sheet contains ten tabs, with the main data tab having 513 rows, and five dynamic graphs, it includes:
- Summary tab
- Funding by Date (and year-by-year graph, and month frequency)
- Funding by Value in descending order (and graph)
- Funding by round type (a form of value)
- Funding by Industry (and graph)
- Comparison to popular social networks (and graph)
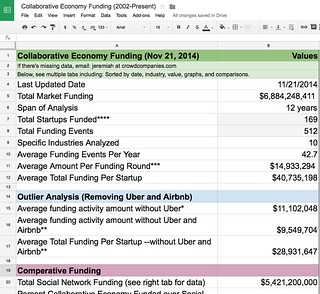
- As of today, there’s been a whopping amount of $6,884,248,411 funded in this market
- Span of Analysis is 12 years, however most has happened this year
- The transportation space has received the greatest amount of funding (see graph), dwarfing all other industries
- Total Startups Funded: 169
- Total Funding Events: 512
- Average Amount Per Funding Round: $14,933,294
- Average Total Funding Per Startup: $40,735,198 (that includes the outliers, like Airbnb and Uber)
- If you remove the outliers (Airbnb and Uber), the Average Total Funding Per Startup is $28,931,647
- There’s been more funding in this market than in Social Networks, by 26%, which I’ve written about on a prior post
Over the years, I’ve analyzed social network funding and the resulting social business software funding, and can see some patterns that are likely to repeat. Don’t expect most of these startups to succeed, as many are clones in a winner-take-all marketplace. Funding continues to pour in, and I expect us to cross the $7 billion marker in just a few months.
Transportation dominates the funding space, with Uber, Lyft, and BlaBlaCar taking the lion’s share. This is “market one” to be impacted, as there are significant numbers of idle vehicles that can be activated using mobile technologies. Crowdfunding, P2P Lending and other crowd-based currency industries are next, closely followed by physical space, and physical goods. Expect additional funding to follow in these categories.
I hope this sheet provides additional market clarity. You can use this funding data to forecast which types of startups will matter in the coming years. I had created a sheet tracking 2014 data, as I saw a surge in Q2. I am now abandoning that for the above sheet, due to the initial project success.

Comments are closed.